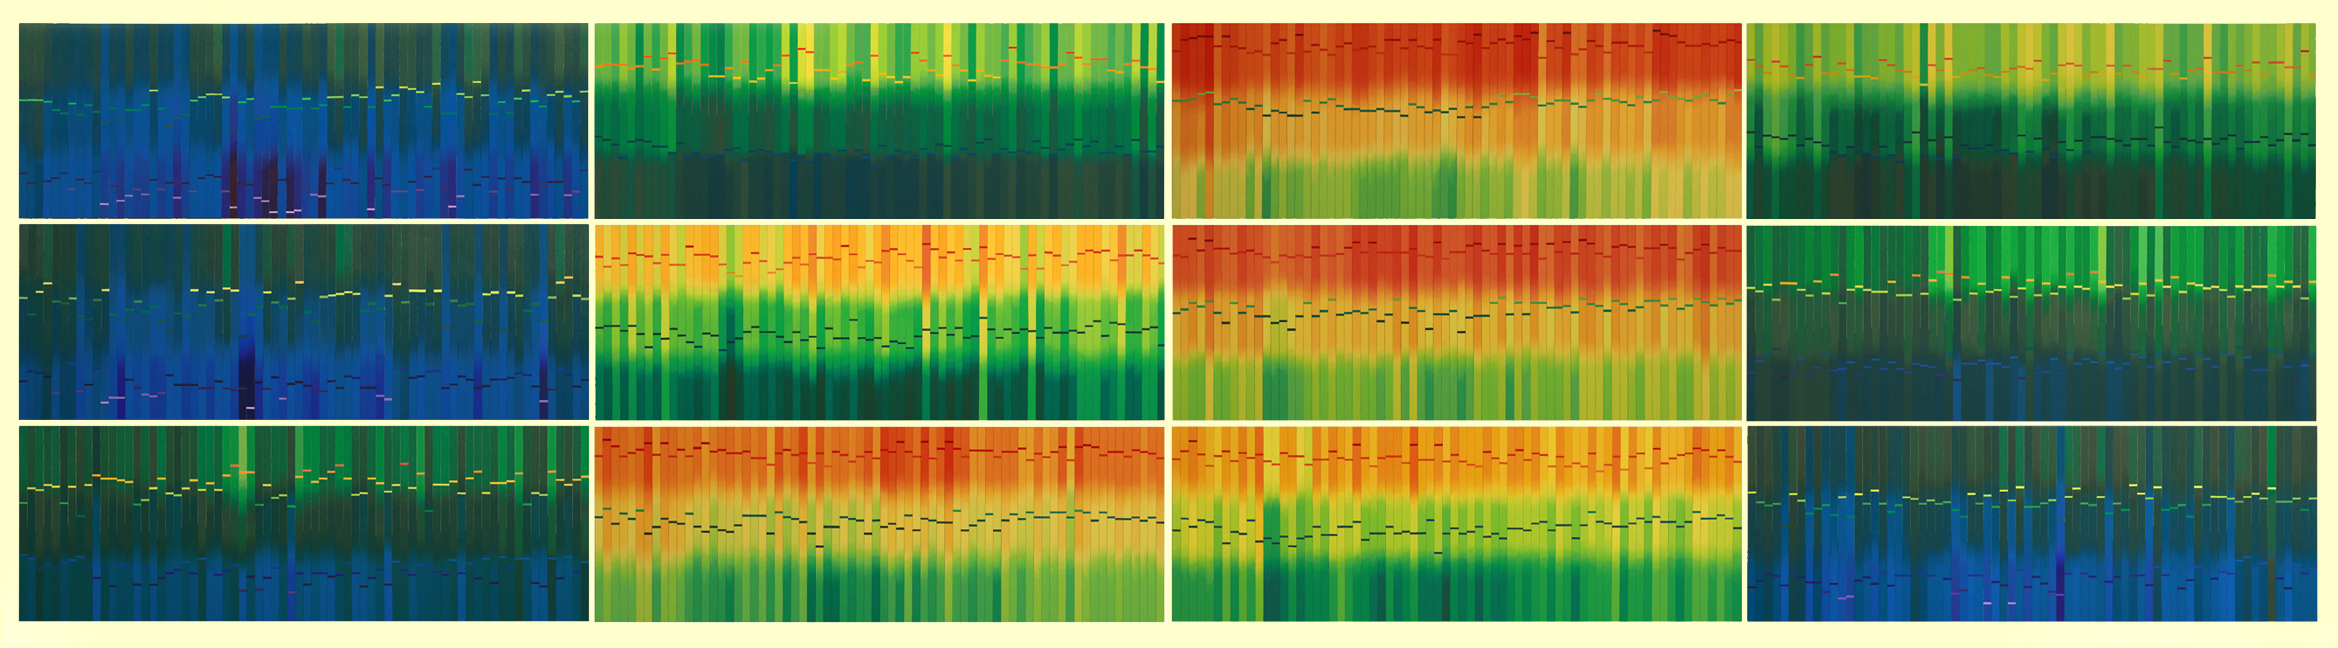
WEATHER PAINTINGS 1951-2020
Each painting represents one month depicting 7 decades, from 1951-2020.
Each vertical stripe (viewed from left to right) represents the average high-median-low temperatures with colors corresponding to each month of each year.
Intersecting small rectangular shapes represent the highest and lowest temperatures that were recorded for that month.
The colors of these shapes travel up and down the incised border of each stripe.
Placement of these shapes correlates with the temperature.
Temperatures were recorded in my home location in Camden County near the Delaware River.
Colors represent temperatures ranging from -7 to 104 degrees F. The paints used are flat acrylics that have a tempera-like appearance.
Changing temperatures depicted through color reveal subtle and sometimes erratic transitions.
Only a few degrees shift us over a tipping point, and a few degrees doesn't look like much on a gradating color chart as they fluctuate over 7 decades.
The changes do become visually apparent in later decades, especially where the nights are not cooling as they once did and new highs are reached.
Each painting is
15"H x 43 3/4""W x 1/2"D
Click on any image for corresponding details
These paintings are constructed as well as painted. The substrate, gessoed birch veneer plywood, is carved with a refurbished dental tool.
Each composition is laid out with incised lines before paint is applied. The outside edges are also painted.
![]()
![]()
| CALENDAR CLOCKS 2015 | WEATHER WHEEL 2019 | WEATHER PORTRAITS 2024 | JULY 22 | CONTACT |